python面积图之怎么实现曲线图的填充
导读:本文共3198字符,通常情况下阅读需要11分钟。同时您也可以点击右侧朗读,来听本文内容。按键盘←(左) →(右) 方向键可以翻页。
摘要: 用法:Axes.fill_between(x,y1,y2=0,where=None,interpolate=False,step=None,*,data=None,**kwargs)参数说明:基础用法importmatplotlib.pyplotaspltimportnumpyasnpx=[1,2,3,4,5]y1=[1,4,9,16,25]y2=[9,... ...
目录
(为您整理了一些要点),点击可以直达。用法:
Axes.fill_between(x,y1,y2=0,where=None,interpolate=False,step=None,*,data=None,**kwargs)
参数说明:
基础用法
importmatplotlib.pyplotaspltimportnumpyasnpx=[1,2,3,4,5]y1=[1,4,9,16,25]y2=[9,9,9,9,9]fig,(ax1,ax2)=plt.subplots(1,2)ax1.fill_between(x,y1,alpha=.5,linewidth=0)ax1.set_title('填充x,y1之间')ax2.fill_between(x,y2,alpha=.5,linewidth=1)ax2.set_title('填充x,y2之间')plt.show()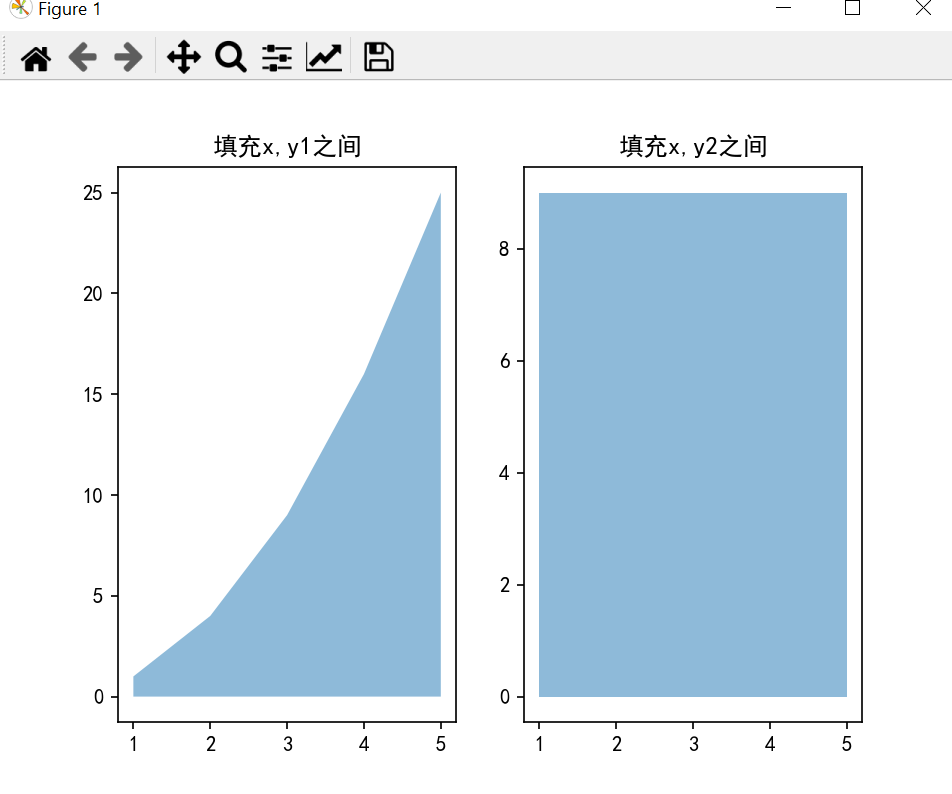
当然这样时没有多大意义的,只是想展示出一个比较明确的填充,类似于区域全部填充颜色
案例
importmatplotlib.pyplotaspltimportnumpyasnpnp.random.seed(1)x=np.linspace(0,8,16)y1=3+4*x/8+np.random.uniform(0.0,0.5,len(x))y2=1+2*x/8+np.random.uniform(0.0,0.5,len(x))fig,ax=plt.subplots()ax.fill_between(x,y1,y2,alpha=.5,linewidth=0)ax.plot(x,(y1+y2)/2,linewidth=2)ax.set(xlim=(0,8),xticks=np.arange(1,8),ylim=(0,8),yticks=np.arange(1,8))plt.show()
复杂的fille_between(案例来源官网)
importnumpyasnpimportmatplotlib.pyplotaspltNsteps,Nwalkers=100,250t=np.arange(Nsteps)#an(NstepsxNwalkers)arrayofrandomwalkstepsS1=0.004+0.02*np.random.randn(Nsteps,Nwalkers)S2=0.002+0.01*np.random.randn(Nsteps,Nwalkers)#an(NstepsxNwalkers)arrayofrandomwalkerpositionsX1=S1.cumsum(axis=0)X2=S2.cumsum(axis=0)#Nstepslengtharraysempiricalmeansandstandarddeviationsofboth#populationsovertimemu1=X1.mean(axis=1)sigma1=X1.std(axis=1)mu2=X2.mean(axis=1)sigma2=X2.std(axis=1)#plotit!fig,ax=plt.subplots(1)ax.plot(t,mu1,lw=2,label='meanpopulation1')ax.plot(t,mu2,lw=2,label='meanpopulation2')ax.fill_between(t,mu1+sigma1,mu1-sigma1,facecolor='C0',alpha=0.4)ax.fill_between(t,mu2+sigma2,mu2-sigma2,facecolor='C1',alpha=0.4)ax.set_title(r'randomwalkersempirical$\mu$and$\pm\sigma$interval')ax.legend(loc='upperleft')ax.set_xlabel('numsteps')ax.set_ylabel('position')ax.grid()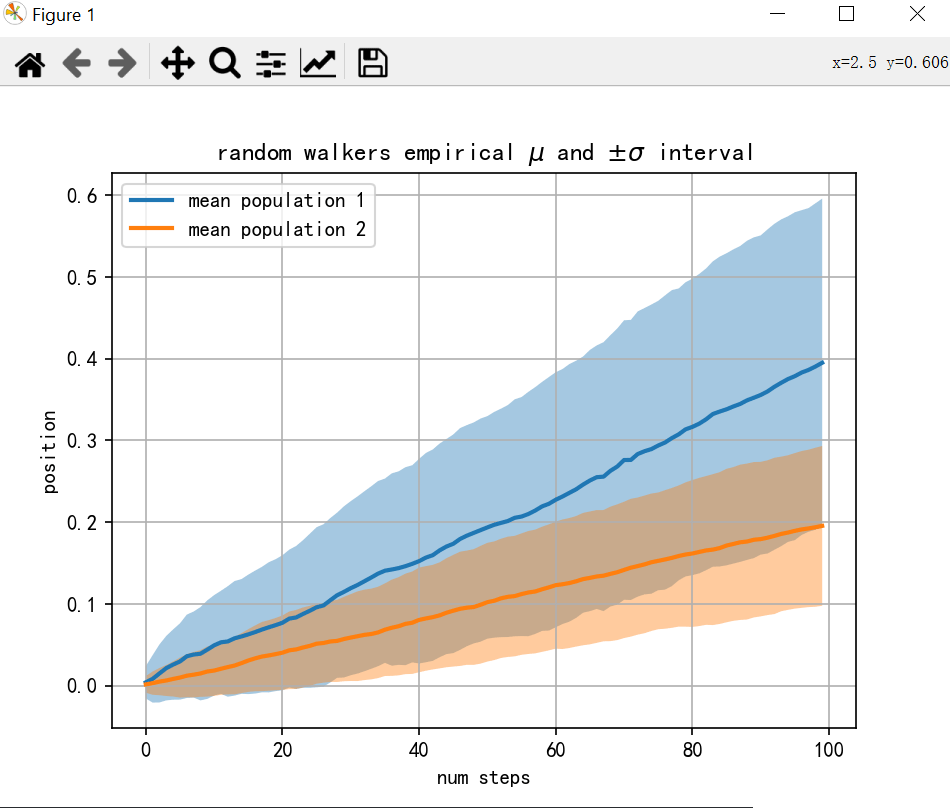
where和interpolate
where
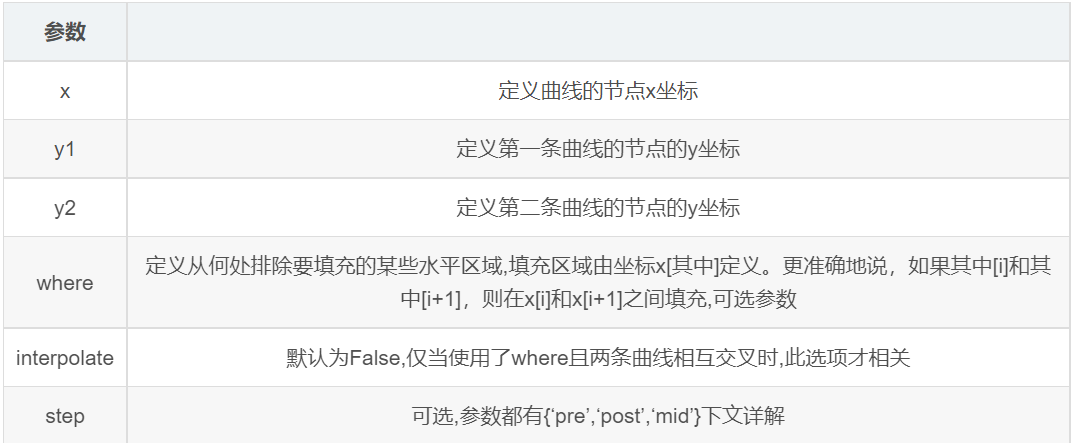
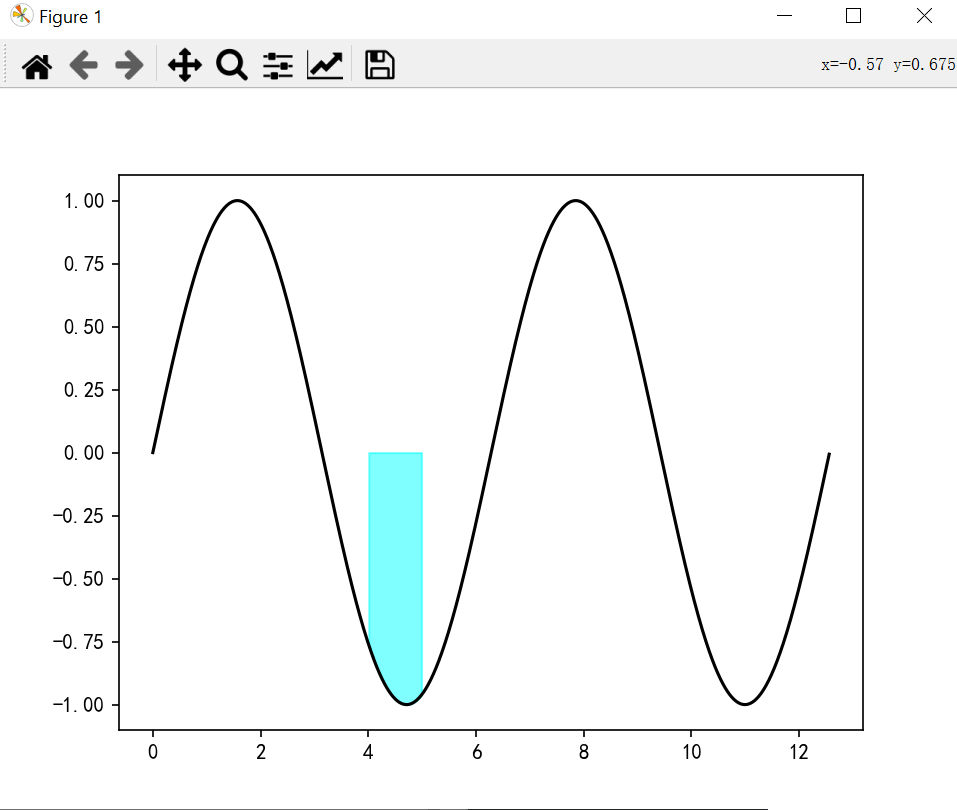
定义从何处排除要填充的某些水平区域。填充区域由坐标x[其中]定义。更准确地说,如果其中[i]和其中[i+1],则在x[i]和x[i+1]之间填充。请注意,此定义意味着where中两个假值之间的孤立真值不会导致填充。由于相邻的假值,真实位置的两侧仍保持未填充状态。
importnumpyasnpimportmatplotlib.pyplotaspltfig,ax=plt.subplots()x=np.arange(0,4*np.pi,0.01)y=np.sin(x)ax.plot(x,y,color='black')ax.fill_between(x,y,0,where=(x>4)&(x<5),color='cyan',alpha=0.5)plt.show()
interpolate
在语义上,where通常用于y1>y2或类似的词。默认情况下,定义填充区域的多边形节点将仅放置在x阵列中的位置。这样的多边形无法描述上述靠近交点的语义。包含交叉点的x截面仅被剪裁。
将“插值”设置为True将计算实际交点,并将填充区域延伸到此点。
importnumpyasnpimportmatplotlib.pyplotaspltx=np.array([0,1,2,3])y1=np.array([0.8,0.8,0.2,0.2])y2=np.array([0,0,1,1])fig,(ax1,ax2)=plt.subplots(2,1,sharex=True)ax1.set_title('interpolation=False')ax1.plot(x,y1,'o--')ax1.plot(x,y2,'o--')ax1.fill_between(x,y1,y2,where=(y1>y2),color='C0',alpha=0.3)ax1.fill_between(x,y1,y2,where=(y1<y2),color='C1',alpha=0.3)ax2.set_title('interpolation=True')ax2.plot(x,y1,'o--')ax2.plot(x,y2,'o--')ax2.fill_between(x,y1,y2,where=(y1>y2),color='C0',alpha=0.3,interpolate=True)ax2.fill_between(x,y1,y2,where=(y1<=y2),color='C1',alpha=0.3,interpolate=True)fig.tight_layout()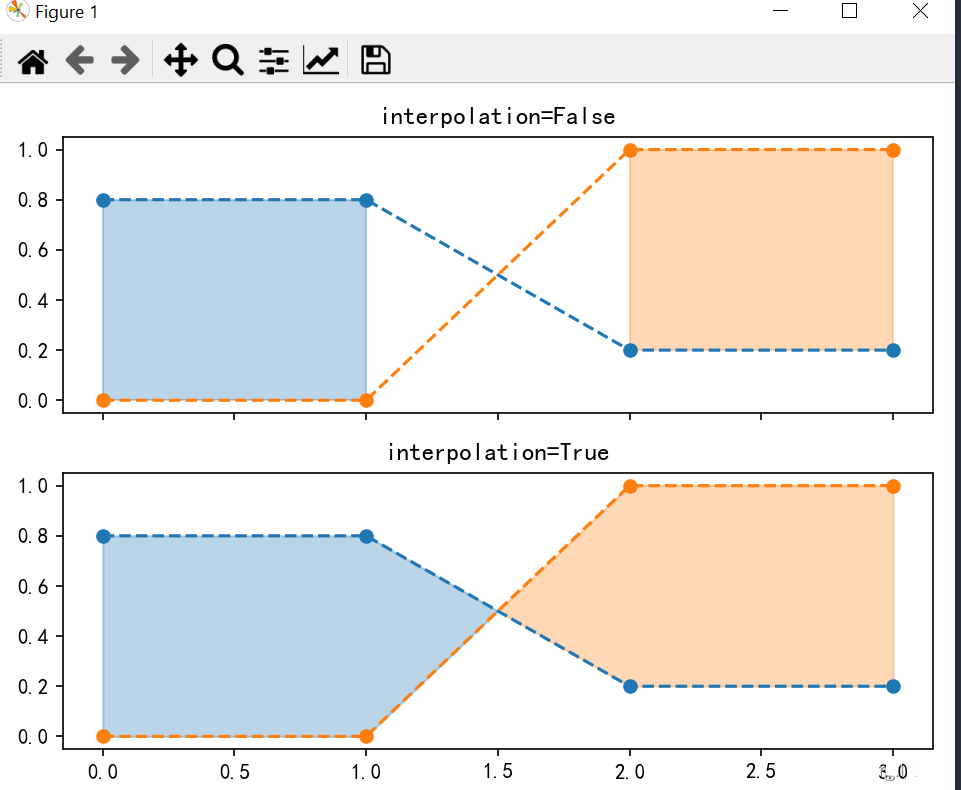
step
包含参数为三个{‘pre’,‘post’,‘mid’}
如果填充应为阶跃函数,即x之间的常数,则定义阶跃。该值确定阶跃发生的位置:
“pre”:y值从每个x位置持续向左,即间隔(x[i-1],x[i]]的值为y[i]。
“post”:y值从每个x位置持续向右,即区间[x[i],x[i+1])的值为y[i]。
“mid”:步数出现在x位置的中间。
importnumpyasnpimportmatplotlib.pyplotasplta=np.linspace(0,2*3.14,50)b=np.sin(a)plt.figsize=((12,6))plt.subplot(131)plt.fill_between(a,b,0,where=(a>2)&(a<5),color='green',step='pre')plt.plot(a,b)plt.title('step=pre')plt.subplot(132)plt.fill_between(a,b,0,where=(a>2)&(a<5),color='cyan',step='post')plt.plot(a,b)plt.title('step=post')plt.subplot(133)plt.fill_between(a,b,0,where=(a>2)&(a<5),color='red',step='mid')plt.plot(a,b)plt.title('step=mid')plt.show()
偏移会有点不一样,因为函数的缘故,偏移不太明显
</div> <div class="zixun-tj-product adv-bottom"></div> </div> </div> <div class="prve-next-news">python面积图之怎么实现曲线图的填充的详细内容,希望对您有所帮助,信息来源于网络。