Vue提供的三种调试方式是什么
导读:本文共1391.5字符,通常情况下阅读需要5分钟。同时您也可以点击右侧朗读,来听本文内容。按键盘←(左) →(右) 方向键可以翻页。
摘要: 一、在 VS Code 中配置调试使用 Vue CLI 2搭建项目时:更新 config/index.js 内的 devtool property:devtool:'source-map',点击在 Activity Bar 里的 Debugger 图标来到 Debug 视图:选择Chrome/Firefox:Launch 环境。将 launch.... ...
音频解说
目录
(为您整理了一些要点),点击可以直达。一、在 VS Code 中配置调试
使用 Vue CLI 2搭建项目时:
更新 config/index.js 内的 devtool property:
devtool:'source-map',
点击在 Activity Bar 里的 Debugger 图标来到 Debug 视图:
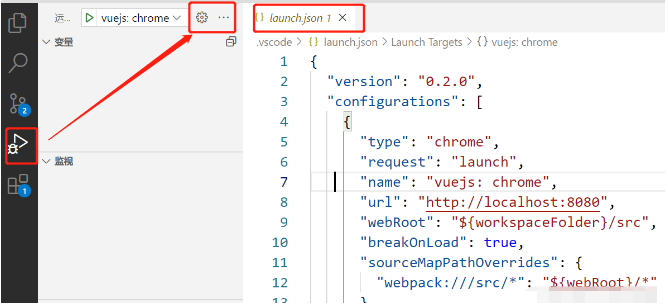
选择Chrome/Firefox:Launch 环境。将 launch.json 的内容替换为:
{"version":"0.2.0","configurations":[{"type":"chrome","request":"launch","name":"vuejs:chrome","url":"http://localhost:8080","webRoot":"${workspaceFolder}/src","breakOnLoad":true,"sourceMapPathOverrides":{"webpack:///src/*":"${webRoot}/*"}},{"type":"firefox","request":"launch","name":"vuejs:firefox","url":"http://localhost:8080","webRoot":"${workspaceFolder}/src","pathMappings":[{"url":"webpack:///src/","path":"${webRoot}/"}]}]}开始调试:
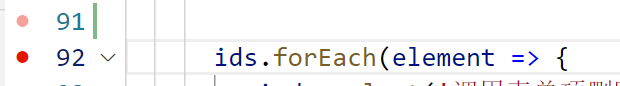
设置断点:
#启动项目npmrundev
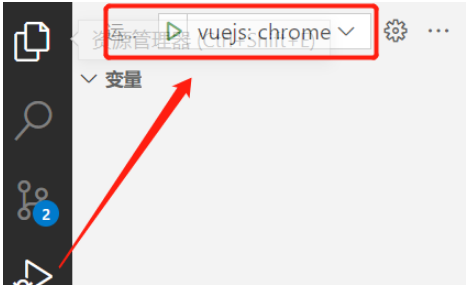
在debug页面选择“vuejs:chrome”:
二、debugger语句
推荐
functionpotentiallyBuggyCode(){debugger//dopotentiallybuggystufftoexamine,stepthrough,etc.}浏览器:F12打开DevTools,当运行程序后,会停在debbger语句:
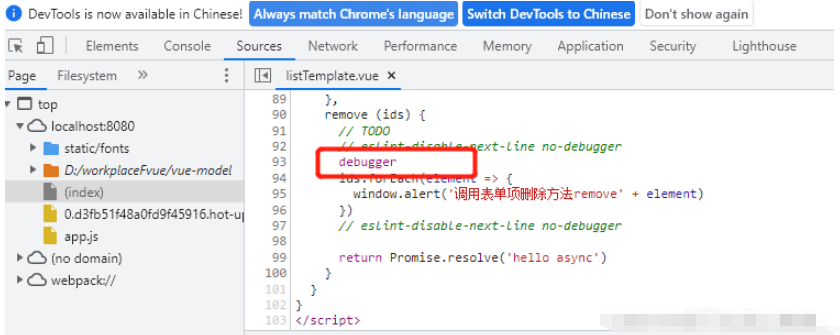
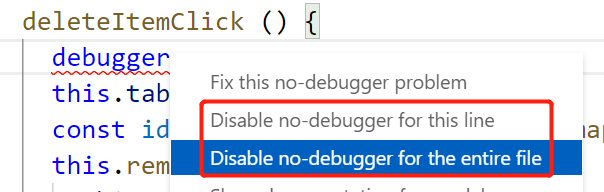
注意:当安装了Eslint插件时,点击快速修复,Disable no-debugger for this line.不然,保存时会自动清除debugger语句。
三、Vue Devtools
谷歌浏览器的插件。
</div> <div class="zixun-tj-product adv-bottom"></div> </div> </div> <div class="prve-next-news">本文:
Vue提供的三种调试方式是什么的详细内容,希望对您有所帮助,信息来源于网络。