Python怎么爬取当网书籍数据并数据可视化展示
导读:本文共5076.5字符,通常情况下阅读需要17分钟。同时您也可以点击右侧朗读,来听本文内容。按键盘←(左) →(右) 方向键可以翻页。
摘要: 一、开发环境Python 3.8Pycharm 2021.2 专业版二、模块使用csv 模块 把爬取下来的数据保存表格里面的 内置模块requests >>> pip install requests 数据请求模块parsel >>> pip install parsel 数据解析模块 css选择器去提取数据三、爬虫代码实现步... ...
音频解说
目录
(为您整理了一些要点),点击可以直达。一、开发环境
Python 3.8
Pycharm 2021.2 专业版
二、模块使用
csv 模块 把爬取下来的数据保存表格里面的 内置模块requests >>> pip install requests 数据请求模块parsel >>> pip install parsel 数据解析模块 css选择器去提取数据
三、爬虫代码实现步骤
导入所需模块
发送请求, 用
python代码模拟浏览器发送请求解析数据, 提取我们想要数据内容
多页爬取
保存数据, 保存
csv表格里面
1. 导入所需模块
importrequests#数据请求模块第三方模块需要pipinstallrequestsimportparsel#数据解析模块第三方模块需要pipinstallparselimportcsv#保存csv表格数据模块内置模块importtime#时间模块
2. 发送请求, 用python代码模拟浏览器发送请求
headers 请求头 作用就是python代码伪装成浏览器 对于服务器发送请求
User-Agent 用户代理 浏览器的基本身份标识
标题中无效的返回字符或前导空格:User-Agent 不要留有空格
通过requests模块里面get请求方法,对于url地址发送请求,并且携带上面header请求头参数,最后用response变量接收返回数据
url=f'http://bang.dangdang.com/books/bestsellers/01.00.00.00.00.00-24hours-0-0-1-{page}'#headers请求头字典数据类型headers={'User-Agent':'Mozilla/5.0(WindowsNT10.0;Win64;x64)AppleWebKit/537.36(KHTML,likeGecko)Chrome/96.0.4664.45Safari/537.36'}response=requests.get(url=url,headers=headers)3. 解析数据, 提取我们想要数据内容
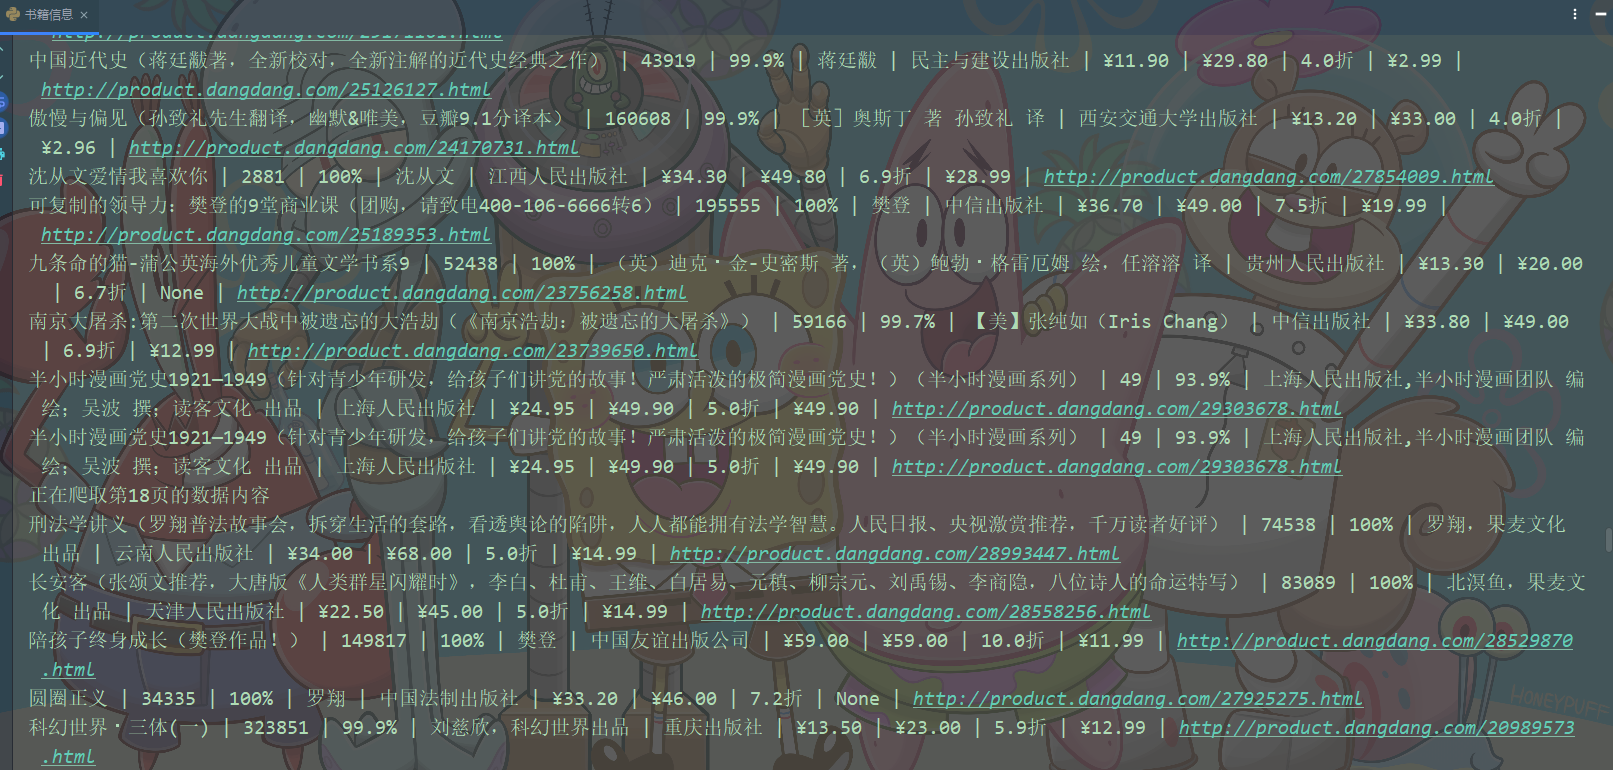
selector=parsel.Selector(response.text)#对于获取到的html字符串数据进行转换selector对象#css选择器就是根据标签属性提取相应的数据lis=selector.css('ul.bang_listli')forliinlis:#.name定位class类名name标签a标签attr()属性选择器取a标签里面title属性get()获取数据title=li.css('.namea::attr(title)').get()#书名#获取标签里面文本数据直接textcomment=li.css('.stara::text').get().replace('条评论','')#评论recommend=li.css('.star.tuijian::text').get().replace('推荐','')#推荐author=li.css('.publisher_infoa:nth-child(1)::attr(title)').get()#作者publish=li.css('div:nth-child(6)a::text').get()#出版社price_n=li.css('.price.price_n::text').get()#售价price_r=li.css('.price.price_r::text').get()#原价price_s=li.css('.price.price_s::text').get()#折扣price_e=li.css('.price.price_e.price_n::text').get()#电子书价格href=li.css('.namea::attr(href)').get()#详情页dit={'书名':title,'评论数':comment,'推荐量':recommend,'作者':author,'出版社':publish,'售价':price_n,'原价':price_r,'折扣':price_s,'电子书价格':price_e,'详情页':href,}csv_writer.writerow(dit)#数据保存到csvprint(title,comment,recommend,author,publish,price_n,price_r,price_s,price_e,href,sep='|')4. 多页爬取
forpageinrange(1,26):#字符串格式化方法print(f'正在爬取第{page}页的数据内容')time.sleep(1.5)url=f'http://bang.dangdang.com/books/bestsellers/01.00.00.00.00.00-24hours-0-0-1-{page}'5. 保存数据, 保存csv表格里面
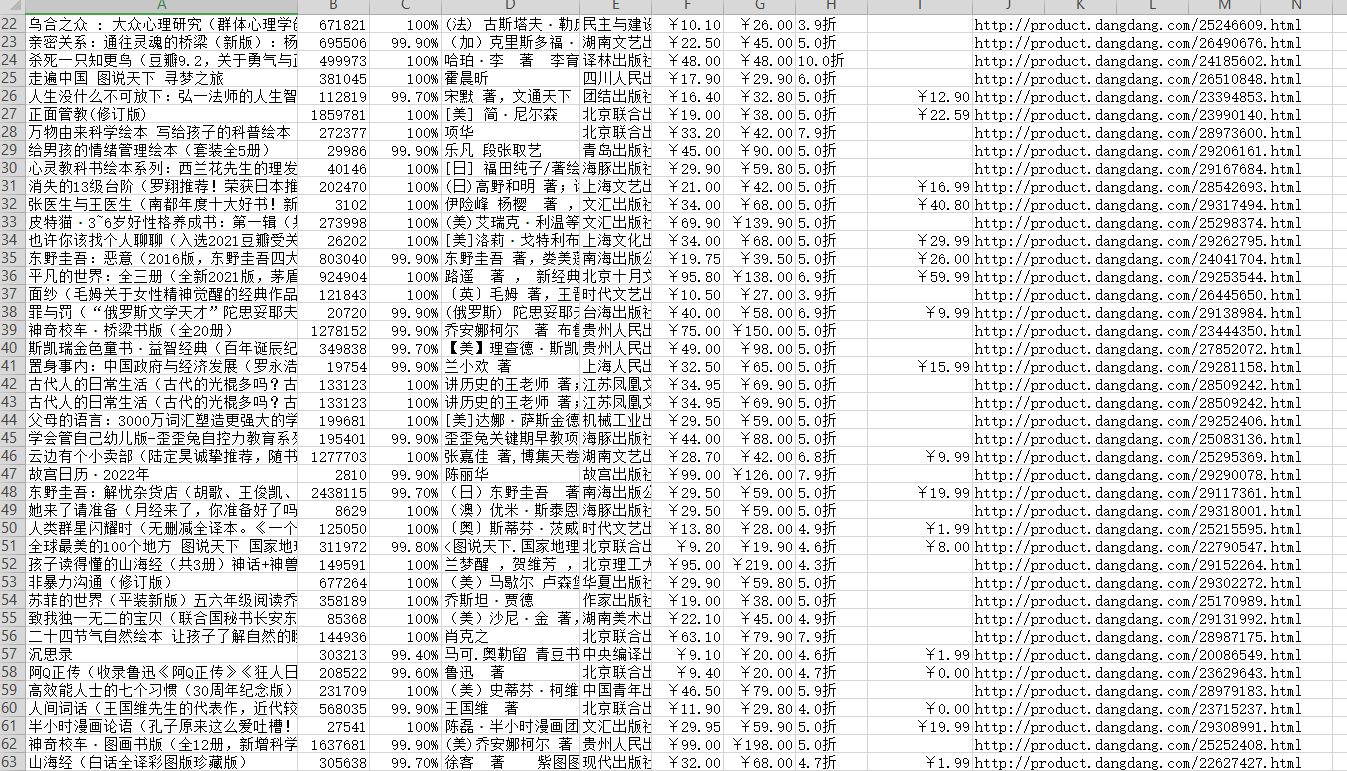
#创建打开一个文件进行保存f=open('当当图书.csv',mode='a',encoding='utf-8',newline='')csv_writer=csv.DictWriter(f,fieldnames=['书名','评论数','推荐量','作者','出版社','售价','原价','折扣','电子书价格','详情页',])csv_writer.writeheader()#写入表头运行代码,效果如下图:
四、数据可视化
1.导入所需模块
importpandasaspdfrompyecharts.chartsimport*frompyecharts.globalsimportThemeType#设定主题frompyecharts.commons.utilsimportJsCodeimportpyecharts.optionsasopts
2.导入数据
df=pd.read_csv('书籍信息.csv',encoding='utf-8',engine='python')df.head()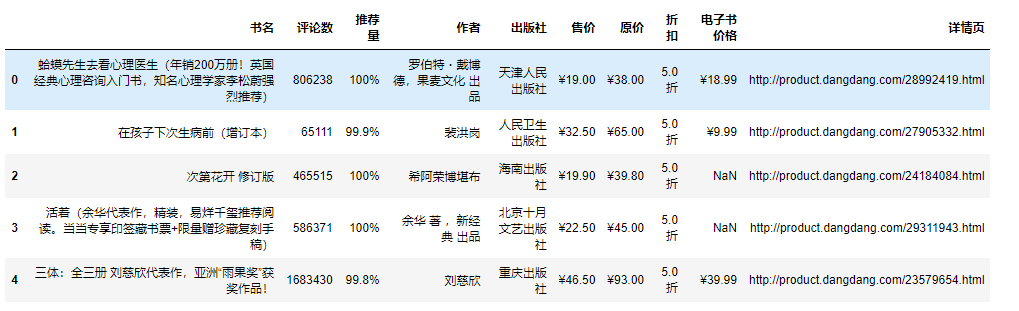
3.可视化
书籍总体价格区间:
pie1=(Pie(init_opts=opts.InitOpts(theme='dark',width='1000px',height='600px')).add('',datas_pair_1,radius=['35%','60%']).set_series_opts(label_opts=opts.LabelOpts(formatter="{b}:{d}%")).set_global_opts(title_opts=opts.TitleOpts(title="当当网书籍\n\n原价价格区间",pos_left='center',pos_top='center',title_textstyle_opts=opts.TextStyleOpts(color='#F0F8FF',font_size=20,font_weight='bold'),)).set_colors(['#EF9050','#3B7BA9','#6FB27C','#FFAF34','#D8BFD8','#00BFFF','#7FFFAA']))pie1.render_notebook()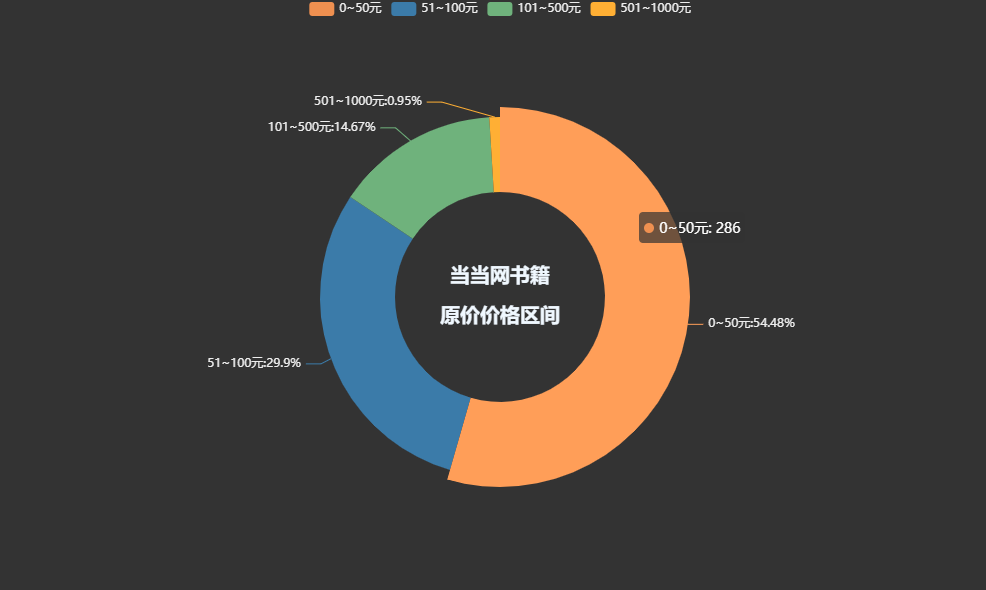
pie1=(Pie(init_opts=opts.InitOpts(theme='dark',width='1000px',height='600px')).add('',datas_pair_2,radius=['35%','60%']).set_series_opts(label_opts=opts.LabelOpts(formatter="{b}:{d}%")).set_global_opts(title_opts=opts.TitleOpts(title="当当网书籍\n\n售价价格区间",pos_left='center',pos_top='center',title_textstyle_opts=opts.TextStyleOpts(color='#F0F8FF',font_size=20,font_weight='bold'),)).set_colors(['#EF9050','#3B7BA9','#6FB27C','#FFAF34','#D8BFD8','#00BFFF','#7FFFAA']))pie1.render_notebook()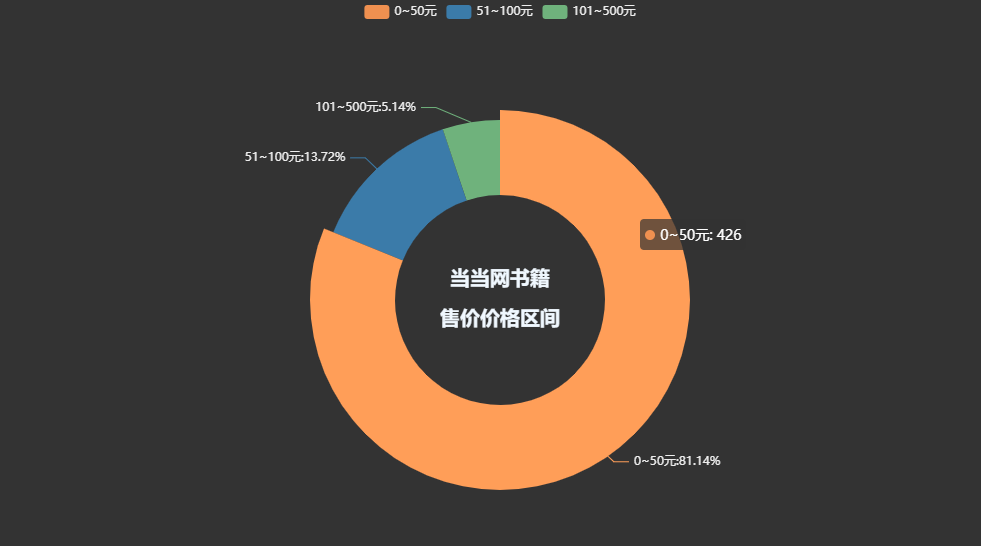
各个出版社书籍数量柱状图:
bar=(Bar(init_opts=opts.InitOpts(height='500px',width='1000px',theme='dark')).add_xaxis(counts.index.tolist()).add_yaxis('出版社书籍数量',counts.values.tolist(),label_opts=opts.LabelOpts(is_show=True,position='top'),itemstyle_opts=opts.ItemStyleOpts(color=JsCode("""newecharts.graphic.LinearGradient(0,0,0,1,[{offset:0,color:'rgb(255,99,71)'},{offset:1,color:'rgb(32,178,170)'}])"""))).set_global_opts(title_opts=opts.TitleOpts(title='各个出版社书籍数量柱状图'),xaxis_opts=opts.AxisOpts(name='书籍名称',type_='category',axislabel_opts=opts.LabelOpts(rotate=90),),yaxis_opts=opts.AxisOpts(name='数量',min_=0,max_=29.0,splitline_opts=opts.SplitLineOpts(is_show=True,linestyle_opts=opts.LineStyleOpts(type_='dash'))),tooltip_opts=opts.TooltipOpts(trigger='axis',axis_pointer_type='cross')).set_series_opts(markline_opts=opts.MarkLineOpts(data=[opts.MarkLineItem(type_='average',name='均值'),opts.MarkLineItem(type_='max',name='最大值'),opts.MarkLineItem(type_='min',name='最小值'),])))bar.render_notebook()书籍评论数最高Top20:
bar=(Bar(init_opts=opts.InitOpts(height='500px',width='1000px',theme='dark')).add_xaxis(price_top.index.tolist()).add_yaxis('书籍单价',price_top.values.tolist(),label_opts=opts.LabelOpts(is_show=True,position='top'),itemstyle_opts=opts.ItemStyleOpts(color=JsCode("""newecharts.graphic.LinearGradient(0,0,0,1,[{offset:0,color:'rgb(255,99,71)'},{offset:1,color:'rgb(32,178,170)'}])"""))).set_global_opts(title_opts=opts.TitleOpts(title='单价最高的书籍详细柱状图'),xaxis_opts=opts.AxisOpts(name='书籍名称',type_='category',axislabel_opts=opts.LabelOpts(rotate=90),),yaxis_opts=opts.AxisOpts(name='单价/元',min_=0,max_=1080.0,splitline_opts=opts.SplitLineOpts(is_show=True,linestyle_opts=opts.LineStyleOpts(type_='dash'))),tooltip_opts=opts.TooltipOpts(trigger='axis',axis_pointer_type='cross')).set_series_opts(markline_opts=opts.MarkLineOpts(data=[opts.MarkLineItem(type_='average',name='均值'),opts.MarkLineItem(type_='max',name='最大值'),opts.MarkLineItem(type_='min',name='最小值'),])))bar.render_notebook()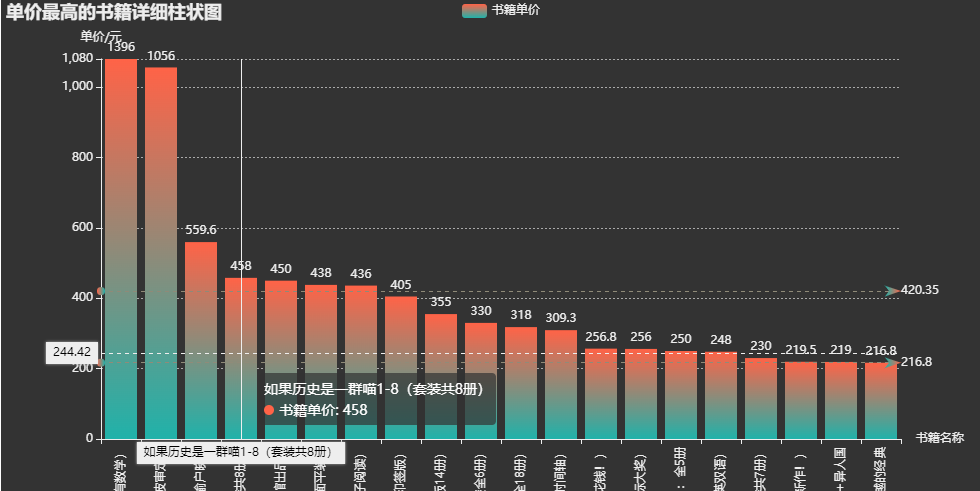
</div> <div class="zixun-tj-product adv-bottom"></div> </div> </div> <div class="prve-next-news">本文:
Python怎么爬取当网书籍数据并数据可视化展示的详细内容,希望对您有所帮助,信息来源于网络。