C#如何实现图表中鼠标移动并显示数据
导读:本文共2099字符,通常情况下阅读需要7分钟。同时您也可以点击右侧朗读,来听本文内容。按键盘←(左) →(右) 方向键可以翻页。
摘要: 具体内容如下效果图:1.首先在页面上添加一个label控件并 默认隐藏:2.给该图表添加MouseMove鼠标移动事件:///<summary>///鼠标经过时发生///</summary>///<paramname="sender"></param>///<paramname=&... ...
音频解说
目录
(为您整理了一些要点),点击可以直达。具体内容如下
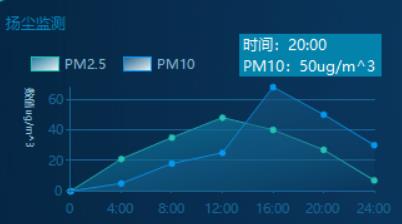
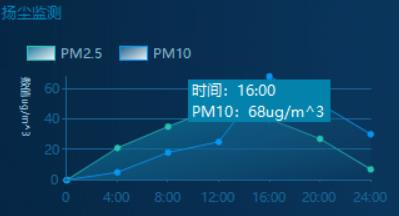
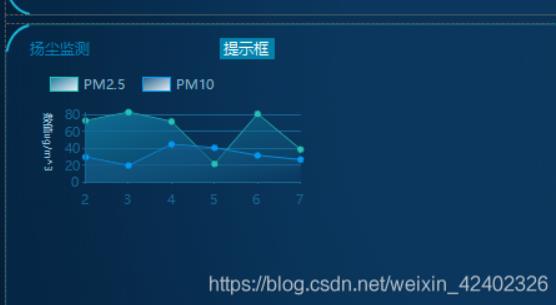
效果图:
1.首先在页面上添加一个label控件并 默认隐藏:
2.给该图表添加MouseMove鼠标移动事件:
///<summary>///鼠标经过时发生///</summary>///<paramname="sender"></param>///<paramname="e"></param>privatevoidchart1_MouseMove(objectsender,MouseEventArgse){try{HitTestResultResult=newHitTestResult();Result=chart1.HitTest(e.X,e.Y);if(Result.Series!=null&&Result.Object!=null){//获取当前焦点x轴的值stringxValue=ObjectUtil.GetPropertyValue(Result.Object,"AxisLabel").ToString();//获取当前焦点所属区域名称stringareaName=ObjectUtil.GetPropertyValue(Result.Object,"LegendText").ToString();//获取当前焦点y轴的值doubleyValue=Result.Series.Points[Result.PointIndex].YValues[0];//鼠标经过时label显示skinLabel4.Visible=true;skinLabel4.Text="时间:"+xValue+"\n"+areaName+":"+yValue+"ug/m^3";skinLabel4.Location=newPoint(e.X,e.Y-20);}else{//鼠标离开时label隐藏skinLabel4.Visible=false;}}catch(Exceptionse){//鼠标离开时label隐藏skinLabel4.Visible=false;}}3.其中GetPropertyValue() 获取对象中的某个属性 方法如下:
publicclassObjectUtil{///<summary>///获取某个对象中的属性值///</summary>///<paramname="info"></param>///<paramname="field"></param>///<returns></returns>publicstaticobjectGetPropertyValue(objectinfo,stringfield){if(info==null)returnnull;Typet=info.GetType();IEnumerable<System.Reflection.PropertyInfo>property=frompiint.GetProperties()wherepi.Name.ToLower()==field.ToLower()selectpi;returnproperty.First().GetValue(info,null);}}另外(以下与上述无关)图表添加数据后绑定提示:
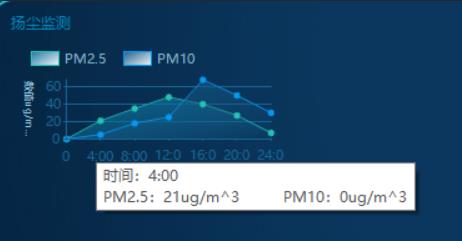
///<summary>///扬尘监测、噪音监测、温度检测、湿度监测///</summary>///<paramname="_Chart"></param>privatevoidChartTemperatureMethod(Chart_Chart){List<string>xData=newList<string>(){"0","4:00","8:00","12:00","16:00","20:00","24:00"};List<int>yData=newList<int>(){0,21,35,48,40,27,7};List<int>yData1=newList<int>(){0,5,18,25,68,50,30};stringiss="#VALX";//需要提示的信息chart1.Series["Series1"].ToolTip="时间:#VALX\nPM2.5:#VALYug/m^3\tPM10:"+yData1[xData.IndexOf("#VALX")+1]+"ug/m^3";//标签显示Inside:内部,Outside:外部,Disabled:禁用chart1.Series["Series1"]["PieLabelStyle"]="Outside";chart1.Series["Series1"].Points.DataBindXY(xData,yData);//需要提示的信息chart1.Series["Series2"].ToolTip="时间:#VALX\nPM2.5:"+yData[xData.IndexOf("#VALX")+1]+"ug/m^3\tPM10:#VALYug/m^3";//标签显示Inside:内部,Outside:外部,Disabled:禁用chart1.Series["Series2"]["PieLabelStyle"]="Outside";chart1.Series["Series2"].Points.DataBindXY(xData,yData1);} </div> <div class="zixun-tj-product adv-bottom"></div> </div> </div> <div class="prve-next-news">本文:
C#如何实现图表中鼠标移动并显示数据的详细内容,希望对您有所帮助,信息来源于网络。