R语言绘制横向柱装图
导读:本文共992字符,通常情况下阅读需要3分钟。同时您也可以点击右侧朗读,来听本文内容。按键盘←(左) →(右) 方向键可以翻页。
摘要: 首先载入颜色扩展包RColorBrewer,具体使用方法可参见下面两篇文章http://book.2cto.com/201408/45552.html,http://tianxingzhe.blog.51cto.com/3390077/1641199library(RColorBrewer)本文以hadoop集群wordcount程序的输出结果为数据源数据的整理... ...
音频解说
目录
(为您整理了一些要点),点击可以直达。首先载入颜色扩展包RColorBrewer,具体使用方法可参见下面两篇文章http://book.2cto.com/201408/45552.html,http://tianxingzhe.blog.51cto.com/3390077/1641199
library(RColorBrewer)
本文以hadoop集群wordcount程序的输出结果为数据源

数据的整理代码如下
x=read.delim("C:/Users/a/Desktop/sample.txt",header=FALSE)#读入文本数据names(x)=c("word","count")#加表头x=transform(x,pct=round(x$count/sum(x$count)*100))#数据框增加百分比列y=x[order(x[,2],decreasing=T),]#排序z=x[sample(nrow(x),20,replace=F),]#随机抽样或者z=head(y,n=11);tail(y,n=11)#抽取前后11行,本例采用了随机抽样绘制横向直方图,详细命令参数解释可参见以下博客http://blog.csdn.net/rav009/article/details/40149405
代码如下:
barplot(rev(z$pct),horiz=T,xlim=c(-4,5),axes=F,col=brewer.pal(11,"BrBG")[1:11])text(seq(from=0.7,length.out=20,by=1.2),x=-0.5,label=rev(z$word))axis(3,c(0,1,2,3,4,5),c('0%','10%','20%','30%','40%','50%'))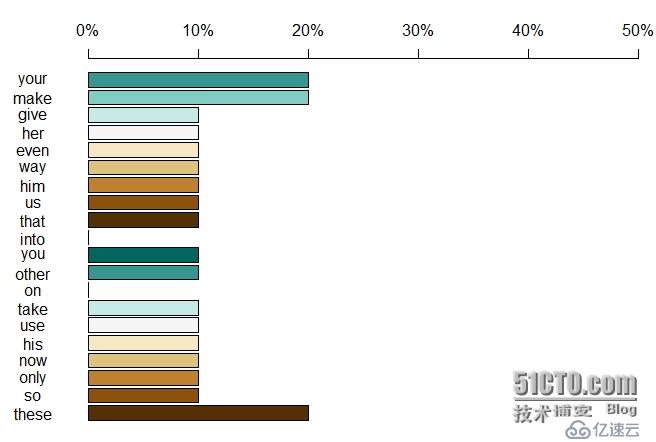
这篇文章大家可以参考参考
http://book.2cto.com/201408/45574.html
</div> <div class="zixun-tj-product adv-bottom"></div> </div> </div> <div class="prve-next-news">本文:
R语言绘制横向柱装图的详细内容,希望对您有所帮助,信息来源于网络。