python scatter散点图用循环分类法加图例
导读:本文共1419字符,通常情况下阅读需要5分钟。同时您也可以点击右侧朗读,来听本文内容。按键盘←(左) →(右) 方向键可以翻页。
摘要: 本文实例为大家分享了python scatter散点图用循环分类法加图例,供大家参考,具体内容如下import matplotlib.pyplot as pltimport kNNplt.rcParams['font.sans-serif']=['Simhei']plt.rcParams['axes.unicode_minus']=Falsed... ...
音频解说
目录
(为您整理了一些要点),点击可以直达。本文实例为大家分享了python scatter散点图用循环分类法加图例,供大家参考,具体内容如下
import matplotlib.pyplot as pltimport kNNplt.rcParams['font.sans-serif']=['Simhei']plt.rcParams['axes.unicode_minus']=FalsedatingDataMat, datingLabels = kNN.file2matrix('datingTestSet2.txt')plt.figure()type1_x = [] #一共有3类,所以定义3个空列表准备接受数据type1_y = []type2_x = []type2_y = []type3_x = []type3_y = []for i in range(len(datingLabels)): #1000组数据,i循环1000次 if datingLabels[i] == '1': #根据标签进行数据分类,注意标签此时是字符串 type1_x.append(datingDataMat[i][0]) #取的是样本数据的第一列特征和第二列特征 type1_y.append(datingDataMat[i][1]) if datingLabels[i] == '2': type2_x.append(datingDataMat[i][0]) type2_y.append(datingDataMat[i][1]) if datingLabels[i] == '3': type3_x.append(datingDataMat[i][0]) type3_y.append(datingDataMat[i][1])plt.scatter(type1_x, type1_y, s=20, c='r', label='不喜欢')plt.scatter(type2_x, type2_y, s=40, c='b', label='魅力一般')plt.scatter(type3_x, type3_y, s=60, c='k', label='极具魅力')plt.legend()plt.show()用面向对象的写法:
import matplotlib.pyplot as pltimport kNNplt.rcParams['font.sans-serif']=['Simhei']plt.rcParams['axes.unicode_minus']=FalsedatingDataMat, datingLabels = kNN.file2matrix('datingTestSet2.txt')plt.figure()axes = plt.subplot(111)type1_x = []type1_y = []type2_x = []type2_y = []type3_x = []type3_y = []for i in range(len(datingLabels)): if datingLabels[i] == '1': type1_x.append(datingDataMat[i][0]) type1_y.append(datingDataMat[i][1]) if datingLabels[i] == '2': type2_x.append(datingDataMat[i][0]) type2_y.append(datingDataMat[i][1]) if datingLabels[i] == '3': type3_x.append(datingDataMat[i][0]) type3_y.append(datingDataMat[i][1])type1 = axes.scatter(type1_x, type1_y, s=20, c='r')type2 = axes.scatter(type2_x, type2_y, s=40, c='b')type3 = axes.scatter(type3_x, type3_y, s=60, c='k')plt.legend((type1, type2, type3), ('不喜欢', '魅力一般', '极具魅力'))plt.show()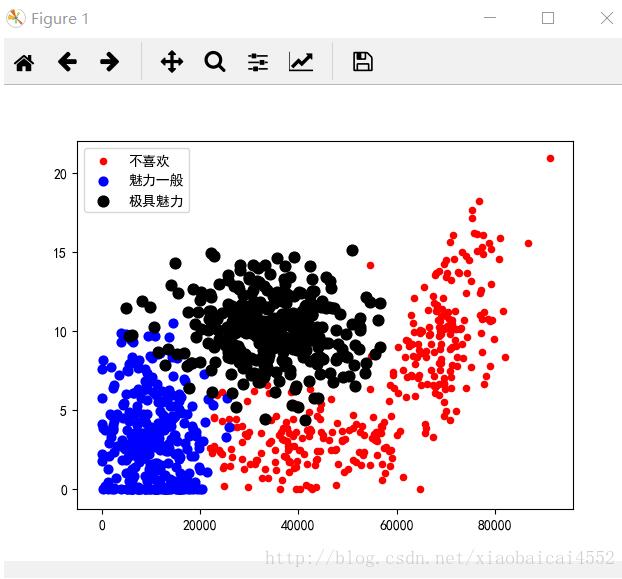
以上就是本文的全部内容,希望对大家的学习有所帮助,也希望大家多多支持。
</div> <div class="zixun-tj-product adv-bottom"></div> </div> </div> <div class="prve-next-news">本文:
python scatter散点图用循环分类法加图例的详细内容,希望对您有所帮助,信息来源于网络。