R语言怎么利用ggplot2绘制QQ图和箱线图
导读:本文共3637字符,通常情况下阅读需要12分钟。同时您也可以点击右侧朗读,来听本文内容。按键盘←(左) →(右) 方向键可以翻页。
摘要: 绘制qq图在ggplot2中绘制qq图需要两步,geom_qq()将绘制样本分位点,geom_qq_line()将绘制标准正态线函数介绍geom_qq()geom_qq(mapping=NULL,data=NULL,geom="point",position="identity",...,distributio... ...
目录
(为您整理了一些要点),点击可以直达。绘制qq图
在ggplot2中绘制qq图需要两步,geom_qq()将绘制样本分位点,geom_qq_line()将绘制标准正态线
函数介绍
geom_qq()
geom_qq(mapping=NULL,data=NULL,geom="point",position="identity",...,distribution=stats::qnorm,dparams=list(),na.rm=FALSE,show.legend=NA,inherit.aes=TRUE)
geom_qq_line(mapping=NULL,data=NULL,geom="path",position="identity",...,distribution=stats::qnorm,dparams=list(),line.p=c(0.25,0.75),fullrange=FALSE,na.rm=FALSE,show.legend=NA,inherit.aes=TRUE)
参数介绍
**aes()**中的映射参数必须包含sample,可选参数有group,x,y distribution
Distribution function to use, if x not specified
dparams Additional parameters passed on to distribution function.
line.p Vector of quantiles to use when fitting the Q-Q line, defaults defaults to c(.25, .75).
fullrange Should the q-q line span the full range of the plot, or just the data
注意事项
**aes()**中的映射参数必须包含sample
例子
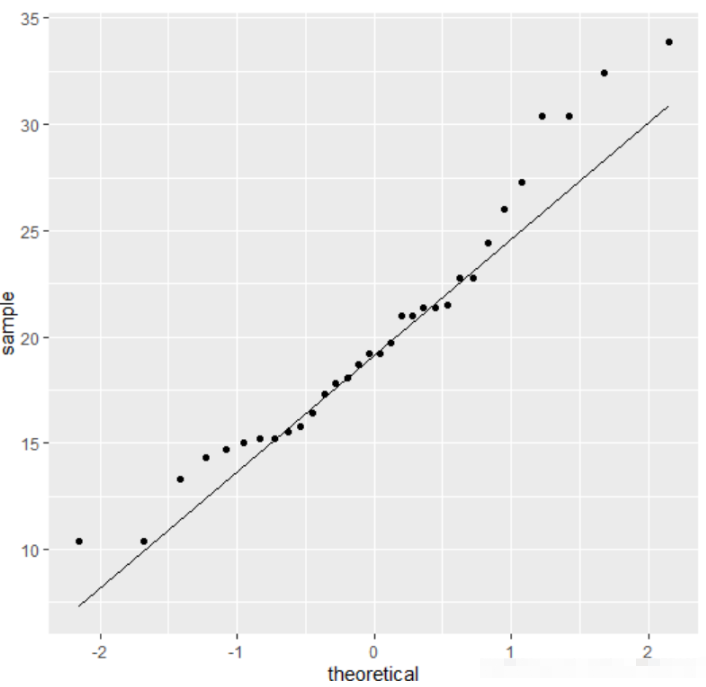
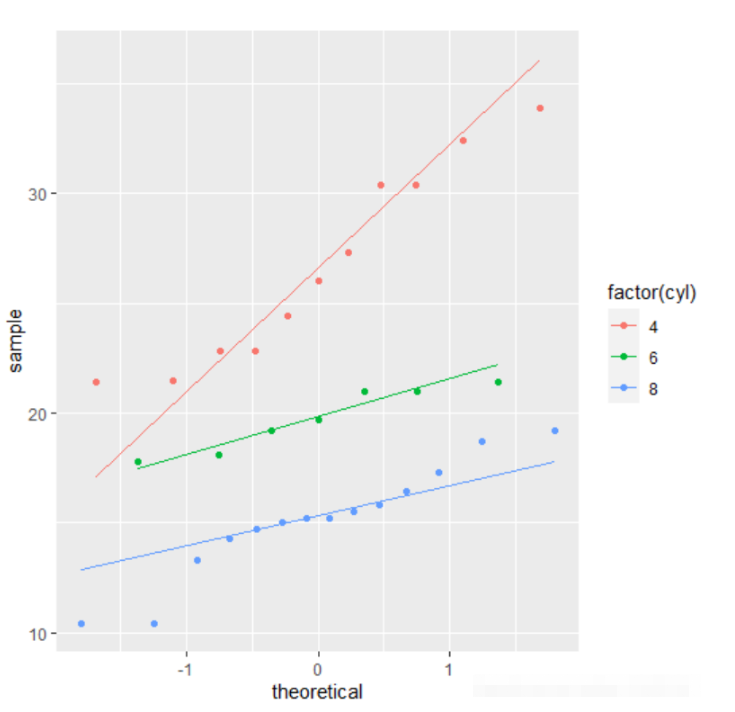
Using to explore the distribution of a variable
ggplot(mtcars,aes(sample=mpg))+stat_qq()+stat_qq_line()ggplot(mtcars,aes(sample=mpg,colour=factor(cyl)))+stat_qq()+stat_qq_line()
绘制boxplot
函数介绍
geom_boxplot(mapping=NULL,data=NULL,stat="boxplot",position="dodge2",...,outlier.colour=NULL,outlier.color=NULL,outlier.fill=NULL,outlier.shape=19,outlier.size=1.5,outlier.stroke=0.5,outlier.alpha=NULL,notch=FALSE,notchwidth=0.5,varwidth=FALSE,na.rm=FALSE,orientation=NA,show.legend=NA,inherit.aes=TRUE)
参数介绍
aes()可接收的参数有:
x or y, 利用x将会是横向箱线图,y的是纵向
lower or xlower
upper or xupper
middle or xmiddle
ymin or xmin
ymax or xmax
alpha
colour
fill
group
linetype
shape
size
weight
notch If FALSE (default) make a standard box plot. If TRUE, make a notched box plot. Notches are used to compare groups; if the notches
of two boxes do not overlap, this suggests that the medians are
significantly different.
notchwidth For a notched box plot, width of the notch relative to the body (defaults to notchwidth = 0.5).
varwidth If FALSE (default) make a standard box plot. If TRUE, boxes are drawn with widths proportional to the square-roots of the
number of observations in the groups (possibly weighted, using the
weight aesthetic).
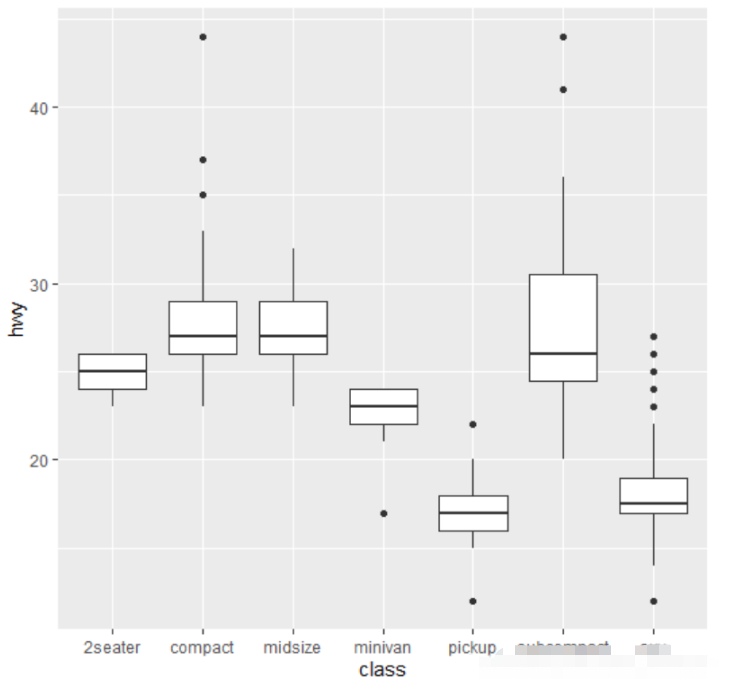
例子
p<-ggplot(mpg,aes(x=class,y=hwy))p+geom_boxplot()
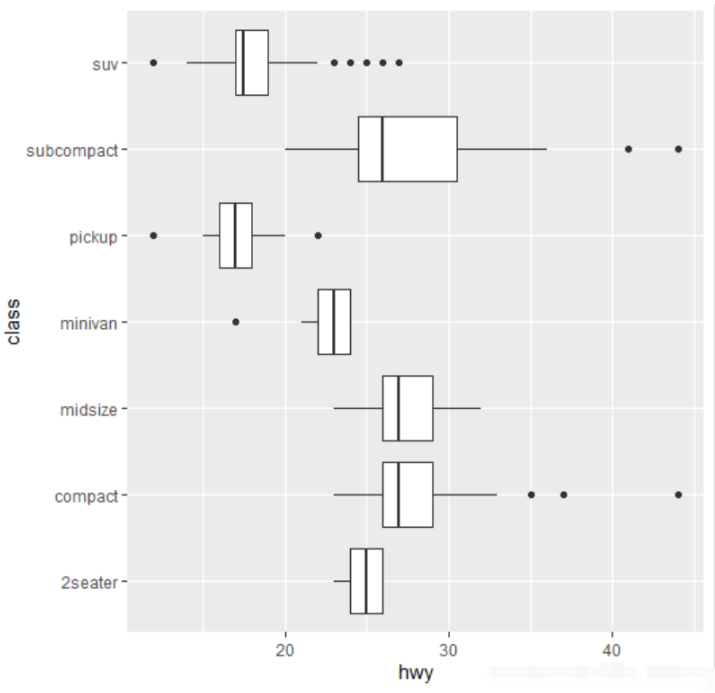
ggplot(mpg,aes(x=hwy,y=class))+geom_boxplot()
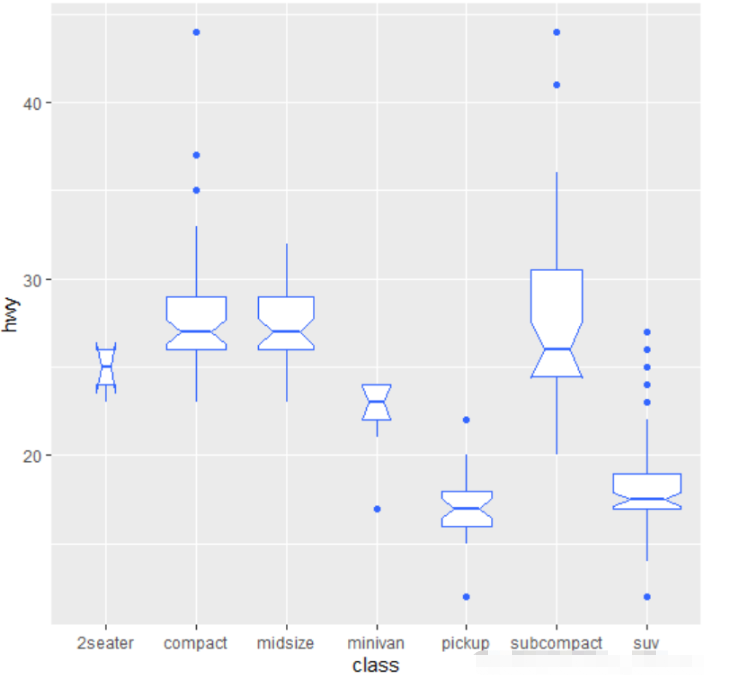
p<-ggplot(mpg,aes(x=class,y=hwy))p+geom_boxplot(notch=TRUE,varwidth=TRUE,fill="white",colour="#3366FF")
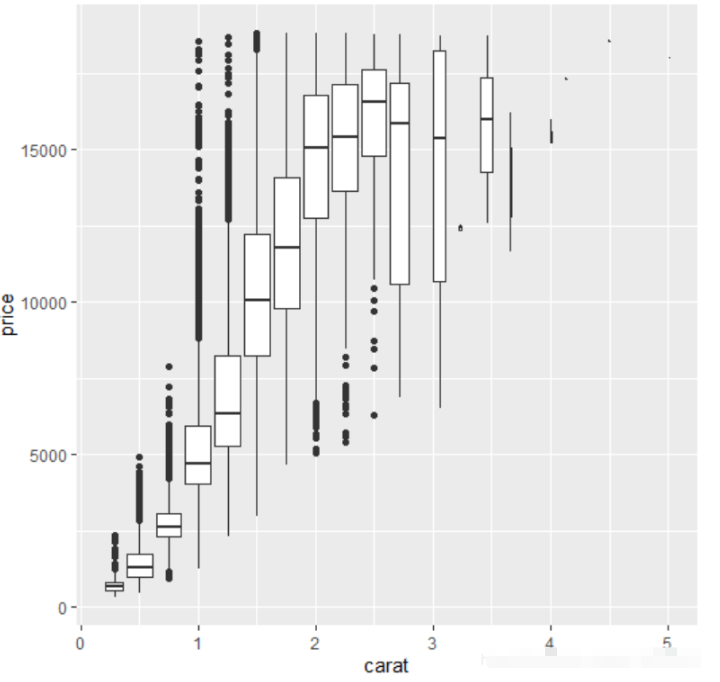
ggplot(diamonds,aes(carat,price))+geom_boxplot(aes(group=cut_width(carat,0.25)))
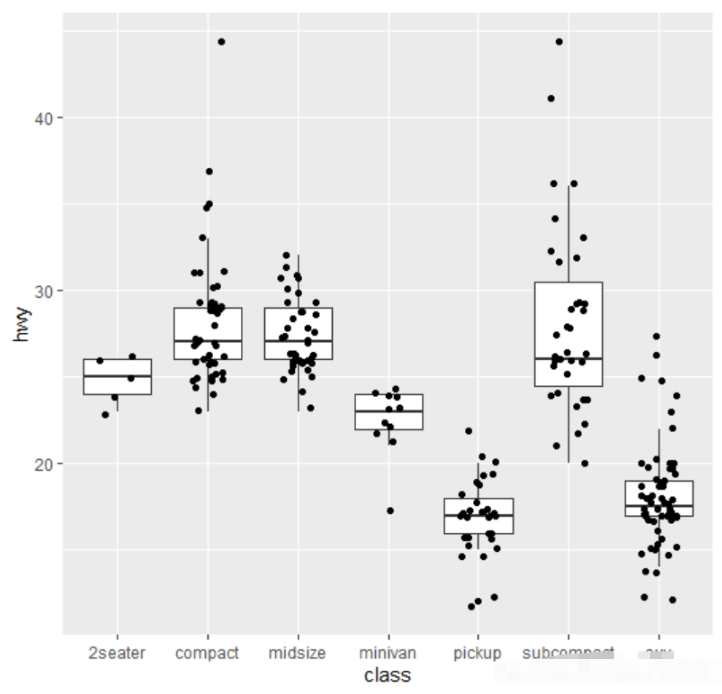
p<-ggplot(mpg,aes(x=class,y=hwy))p+geom_boxplot(outlier.shape=NA)+geom_jitter(width=0.2)
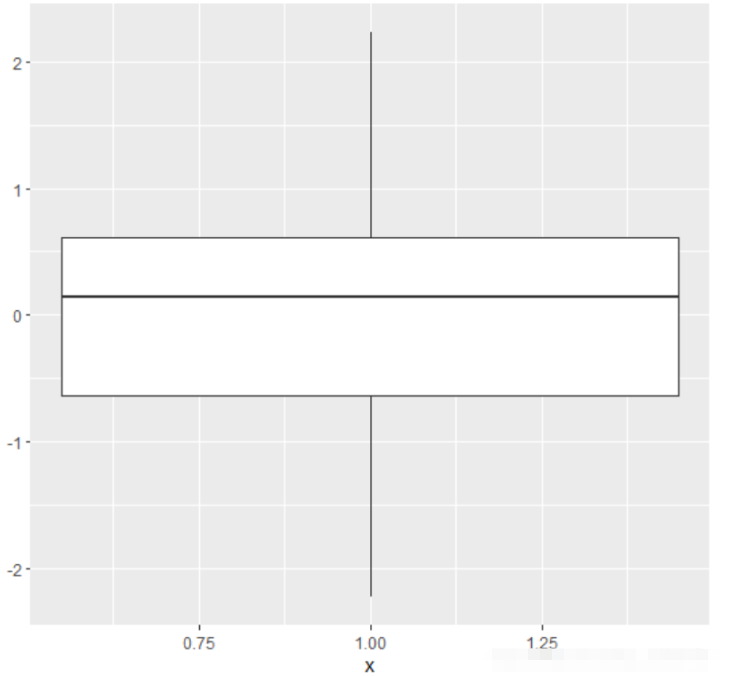
利用分位点绘制箱线图
y<-rnorm(100)df<-data.frame(x=1,y0=min(y),y25=quantile(y,0.25),y50=median(y),y75=quantile(y,0.75),y100=max(y))ggplot(df,aes(x))+geom_boxplot(aes(ymin=y0,lower=y25,middle=y50,upper=y75,ymax=y100),stat="identity")
将QQ图和箱线图进行融合
函数介绍
该函数是来自于qqboxplot包,因此使用前需要安装
geom_qqboxplot(mapping=NULL,data=NULL,stat="qqboxplot",position="dodge2",...,outlier.colour=NULL,outlier.color=NULL,outlier.fill=NULL,outlier.shape=19,outlier.size=1.5,outlier.stroke=0.5,outlier.alpha=NULL,notch=FALSE,notchwidth=0.5,varwidth=FALSE,na.rm=FALSE,show.legend=NA,inherit.aes=TRUE)
参数介绍
大部分参数和geom_qq()和geom_boxplot()中的参数含义相同
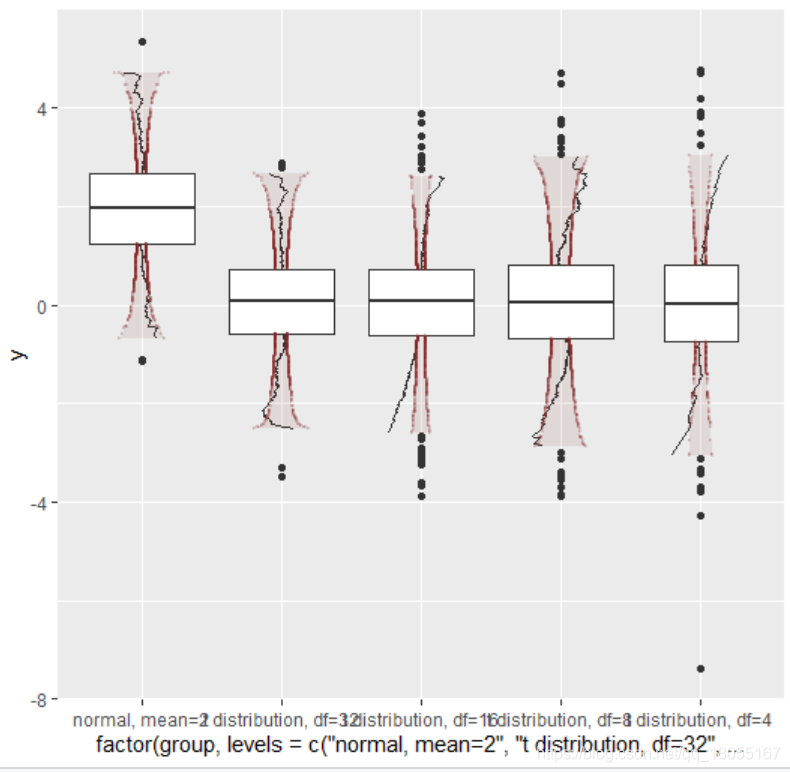
reference_dist 表示参数比较的标准分布名称,如果有参数需要有dparams
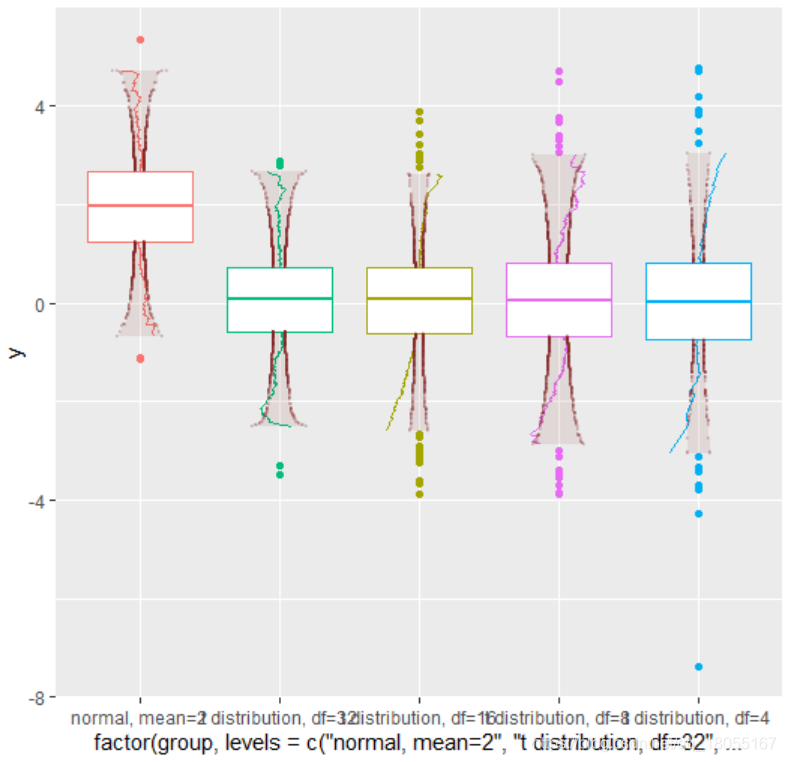
compdata 用于比较的标准样本数据,是个向量
注意事项
aes()函数中的y不可缺
例子
library(dplyr)library(ggplot2)library(qqboxplot)simulated_data=tibble(y=c(rnorm(1000,mean=2),rt(1000,16),rt(500,4),rt(1000,8),rt(1000,32)),group=c(rep("normal,mean=2",1000),rep("tdistribution,df=16",1000),rep("tdistribution,df=4",500),rep("tdistribution,df=8",1000),rep("tdistribution,df=32",1000)))p<-ggplot2::ggplot(simulated_data,ggplot2::aes(factor(group,levels=c("normal,mean=2","tdistribution,df=32","tdistribution,df=16","tdistribution,df=8","tdistribution,df=4")),y=y))p+geom_qqboxplot()p+geom_qqboxplot(reference_dist="norm")p+geom_qqboxplot(compdata=comparison_dataset)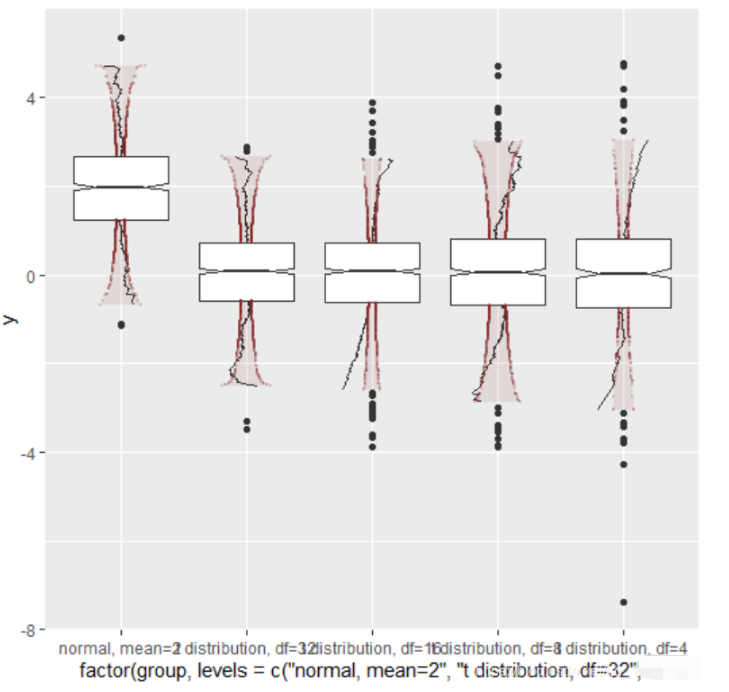
</div> <div class="zixun-tj-product adv-bottom"></div> </div> </div> <div class="prve-next-news">R语言怎么利用ggplot2绘制QQ图和箱线图的详细内容,希望对您有所帮助,信息来源于网络。